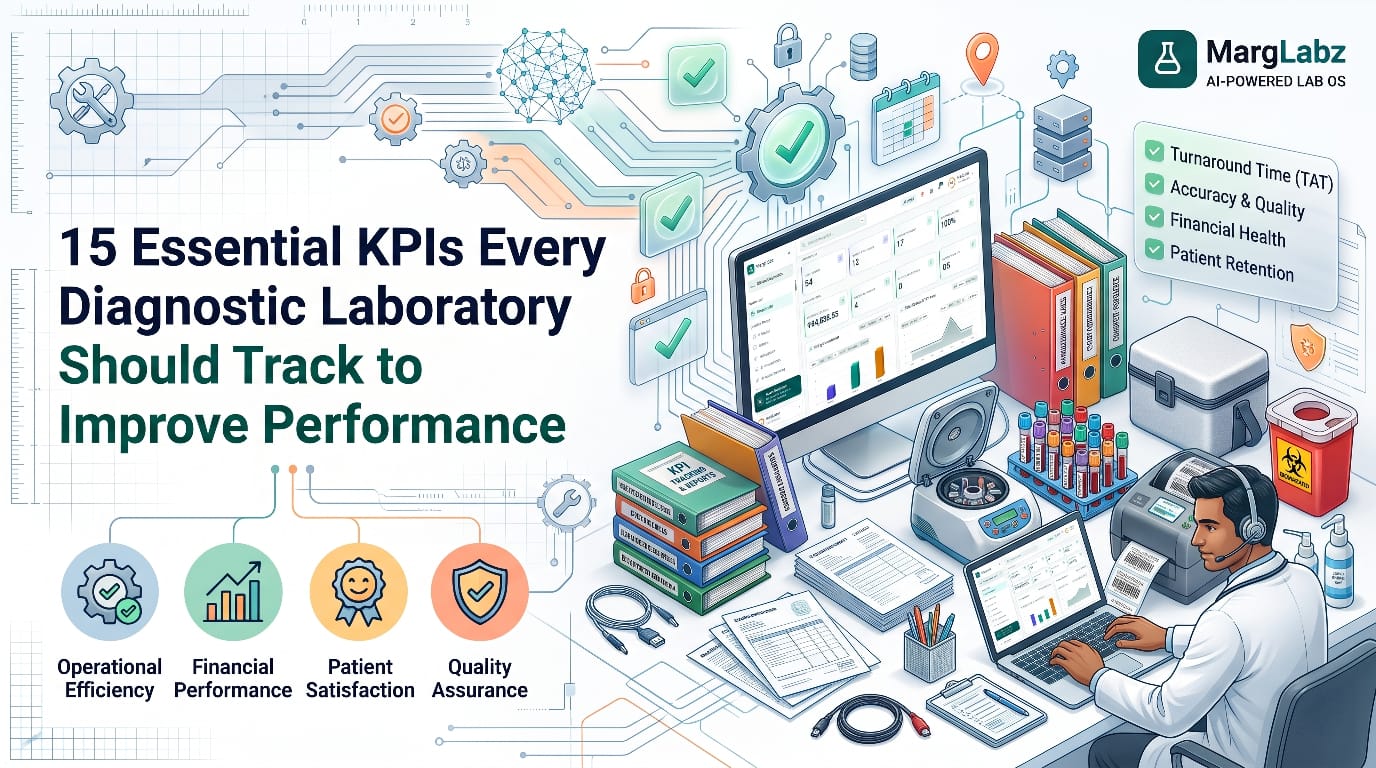
Diagnostic laboratories have many KPIs (Key Performance Indicators) which are basically the few measurable metrics that indicate how efficiently a laboratory operates in terms of time, quality, cost, service delivery, and work load of staff. For instance, a laboratory can process several hundred samples daily, however, sample volume does not reflect delays in processing, rejections, waste generated, or unpaid bills. This document outlines 15 different types of KPIs in five categories, each with its own formula and a theoretical Indian laboratory as an example. It should be noted that the examples used in this document are for illustrative purposes only, and are not to be considered as standards. Appropriate performance goals will depend on factors such as test menu offered by the laboratory, size of the laboratory, type of equipment utilized, operational processes, and relevant regulatory requirements.
A. Operational Performance KPIs
1.Laboratory Turnaround Time (TAT)
Turnaround Time (TAT) is the time span from when a sample arrives at the lab to when the final report is generated. It's the number that doctors and patients care about the most. Formula: Final Report Release Time – Sample Arrival Time. For example, if you sent in a Complete Blood Count (CBC) at 8:30 a.m. and received the results back at 10:15 a.m. then your turnaround time was 1 hour 45 minutes. You should monitor your daily median TAT for each type of test as well as the percentage of reports released on schedule. If there are trends showing that many of your delays occur during your morning rush hour consider examining your staffing levels and/or how samples are batched.
2.Sample Collection-to-Receipt Time
The amount of time a sample takes to get from where it was collected to the laboratory. Formula: arrival time - collection time. For example, if a tube was collected at 7:40 AM and arrived at the hub at 10:10 AM, then that tube spent two and one half hours in transit. Each day review this information by collection center and courier route. If you see consistently long or variable transit times, look into when samples are being picked up and what the limits are for each test in your Standard Operating Procedures (SOPs).
3.Sample Rejection Rate
This shows the number of samples received that cannot be tested, usually due to labeling issues, inadequate sample size, hemolysis, or poor shipping. Formula: (samples rejected / samples received) x 100. For example, if 24 of 800 were rejected, the rejection percentage would be 3%. Review weekly for reasons and locations; then re-train when there appears to be a single cause. We have written a guide to help reduce sample rejection rates further.
4.Daily Test Volume
The total number of tests reported each day is referred to as "daily test volume." This can be broken down into daily tests reported by both department and branch. Formula: daily tests reported. For example, if there were 420 tests reported on Monday and 310 on Thursday, then you would want to staff based on the peak that occurred on Monday. You should review this data daily and weekly. Although daily test volume alone does not tell us much about our efficiency, it affects every other measurement.
5.Analyzer Utilization Rate
This represents what portion of your analyzer's functional capability you have utilized. Formula: (tests conducted / available functional capability) * 100, where available functional capability is determined by the manufacturers stated output rate and number of operational hours per day. For example, if an analyzer has conducted 1,200 tests and has a practical capacity of 2,000, then it is operating at 60% of its capacity. A low percentage indicates underutilized capacity; while a high percentage indicates potential bottlenecks. These percentages should be reviewed each week in conjunction with equipment downtime.
B. Quality and Accuracy KPIs
6.Report Correction / Amended Report Rate
Amended Reports: Reports that have been altered after they were originally published. Formula: (Amended Reports / Published Reports) * 100. If there are six amendments out of 1,500 reports published, then this would equal 0.4%. An increasing number of amendments, or if the same problem (i.e., transcription error or incorrect patient information) occurs repeatedly, may indicate that there is a problem with how data is entered or reviewed. Review the data on a weekly basis, and document why each amendment was made.
7.Internal Quality Control (IQC) Failure Rate
The proportion of quality control runs that do not meet your acceptance criteria. Formula: (number of failed QC runs / number of all QC runs) x 100. Nine failed runs out of 300 runs equals 3%. Analyze quality control data based upon the analyte, the analyzer used to run the tests and the reagent lot used, since a cluster may be caused by a reagent lot change or calibration issue. Evaluate quality control daily and maintain records of corrective actions taken.
8.External Quality Assessment (EQA) Performance
The purpose of EQA/proficiency testing is to compare the performance of your laboratory to the performance of other laboratories using a third-party testing agency. While there are some differences in how each testing agency calculates scores, a basic way to calculate a percentage of success is by dividing the number of acceptable results by the total number of results you submitted and then multiplying that value by 100. For example, if you had 18 out of 20 results acceptable, your percentage would be 90%. Any unacceptable result will require an investigation and documented corrective action. You should review each cycle of testing and follow-up with corrective actions at least once per month.
9.Critical Result Notification Time
The amount of time required to report a critical finding can be important in determining whether immediate medical intervention is necessary; therefore, how quickly the reporting physician is contacted is as important as how the notification was documented. Formula: Notification Time minus Result Verification Time. If a result was verified at 11:05 and reported at 11:20 then it took 15 minutes. Check your laboratory's policy for reporting critical findings and targets. You should review each day's events and provide monthly summaries.
C. Financial Performance KPIs
10.Cost Per Test
The average cost of producing a single reportable result can be defined as the cost per test. This includes all costs associated with reagents, consumable items, labor (staffing), capital (equipment), and general business expenses (overheads). Cost per test can be calculated using the formula: total costs / reportable tests. For example, if you spent ₹840,000 on 6,000 tests then each test would cost you ₹140. Compare your test cost to the price that you charge for the test. Monthly review is recommended, starting with evaluating the reagent portion of the test since reagents tend to fluctuate in price more frequently than other components of the test.
11.Revenue Per Test
The money generated from every single test after discounts is shown here. The formula used to calculate this was total revenue divided by tests. For example, if you made ₹12,00,000 off of 6,000 tests, then you generated ₹200 per test. Therefore, the amount remaining for your profit before any other costs are taken into consideration would be ₹60. Please provide the same information on a monthly basis for each test, panel, and client category. Any panel which has revenue sitting close to the cost of that panel will require a review of its pricing strategy or its source.
12.Outstanding Payments and Receivables
The amounts that have been billed but not yet collected, which typically happens in hospitals, corporate businesses, and collection agencies. Formula: (Outstanding Amount / Total Billed Amount) * 100, segmented by Age. An outstanding amount of ₹90,000 against a total billed amount of ₹12,00,000 equates to 7.5%. In the event that ₹40,000 of this amount has been outstanding for longer than 30 days, pursue these accounts first. Conduct weekly reviews based on individual clients.
13.Reagent and Consumable Wastage Rate
This figure represents the money lost due to product expiration, spoilage, or repeat orders that could have been avoided. Formula: (amount of money wasted ÷ amount of money spent on products) x 100. For example, if you spent ₹3,00,000 on products, but had ₹15,000 worth of expired stock, then your loss percentage would be 5%. There are several reasons why this might occur, such as overstocking, buying the wrong size of products, or having inadequate systems for tracking product expiration. You should review these figures every month, and you should also check product expiration dates every week.
D. Patient and Service Performance KPI
14.Patient Complaint Resolution Rate
This formula determines whether complaints have been resolved within your designated timeframe and not merely logged. Formula: (complaints resolved within the designated time frame / complaints submitted) * 100. For example, if you resolve 18 out of 20 complaints in less than 48 hours then you will achieve 90%. Categorize complaints into common causes (i.e., delay, billing issues, etc.) and address those that recur. Perform reviews weekly and monthly.
E. Workforce Productivity KPI
15.Tests Processed Per Staff Member
The formula to determine the general idea of how hard everyone has been working is tests reported/staff on duty or tests reported/staff hours. For example, if there are 420 tests and 7 technicians, then each technician can report 60 tests. The formula can be adjusted depending upon the difficulty level of the tests being run, so that it can be used to help decide which days/shifts technicians should work rather than as a tool to pressure them. It should be reviewed every week for both shift and department.
Why Diagnostic Laboratory KPIs Matter
A KPI converts an impression of being busy and behind schedule into a measurable unit of comparison on a weekly basis. With many labs in India operating with low margins and receiving samples from numerous centers, even small leaks will rapidly accumulate. Monitoring these will help identify delays, issues with quality, wasteful use of reagents, and delays in collection of samples prior to becoming larger. Quality indicators (e.g., amended reports, IQC failures) vary from operational KPIs (e.g., sample volume) therefore, you will require both types of indicators. Tracking KPIs does not assure NABL Accreditation or ISO 15189 compliance.
How to Build a Practical Laboratory KPI Dashboard
Begin by identifying 6 to 8 key performance indicators (KPIs). For every one of these, create a written definition of what it is. Then assign responsibility for each to a specific individual and decide together who will review the performance of these KPIs.
| KPI | What to measure | Review | Why it matters |
|---|---|---|---|
| TAT | Median hours by test | Daily | Service reputation |
| Rejection rate | % of samples received | Weekly | Cost and patient burden |
| IQC failure rate | % of QC runs | Daily | Result reliability |
| Collection-to-receipt time | Hours from draw to hub receipt | Daily | Sample suitability and TAT |
| Cost per test | ₹ per reportable test | Monthly | Margin |
| Outstanding dues | % billed, by age | Weekly | Cash flow |
| Complaint resolution | % closed in target time | Weekly | Patient trust |
| Reagent wastage | % of purchase value | Monthly | Preventable cost |
How Often Should Laboratory KPIs Be Reviewed?
The first set of metrics is tracked daily. These are the TAT (turnaround time), the number of failed IQCs (internal quality control tests) the time it takes to report critical results, and the total volume of tests performed. The second set of metrics is monitored weekly. This includes the number of rejected tests, the amount of money owed to the laboratory, customer complaints, and the workload of the staff. The third set of metrics is reported monthly. These include the average cost of performing a test and the average amount of money earned from each test performed, the amount of waste generated by the laboratory, and the number of amended reports issued by the laboratory. Every three months, the definitions and targets used for all of these metrics should be reviewed with both your pathologist and your quality manager.
Common Mistakes Laboratories Make While Measuring KPIs
Many labs use too many metrics to evaluate performance and then fail to use any of those metrics. Many labs also define their performance metrics differently each month. Some labs rely on averages of delay times, which can mask the longest delays. Many labs copy the performance goals of other organizations. Some labs enter their performance data late and/or incorrectly. Additionally, some labs focus solely on volume when evaluating performance. Finally, many labs rank employees based upon a single metric.
How Laboratory Management Software Helps Track Performance
KPIs are built upon clean, connected data. If you have all your registration, samples, results, billing, and inventory sitting in a single system, you can produce a variety of metrics without doing any manual counts. MargLabz is an AI-powered Lab OS that has 40+ different modules. These modules include a dashboard for orders, samples, reports, and TAT, MIS and insights reporting, outstanding and ageing views, a cost-per-reportable-test view, and IQC using Westgard rules. Please refer to our guides regarding daily lab operations and common management issues.
Turning Laboratory Data into Better Business Decisions
When the TAT is low (9-11 am), then review staffing and batching. When there are high rejection rates at a particular center, then re-train staff at that center. When a panel's earnings are only slightly above its costs, then re-visit the price of the panel or the source of materials used to create the panel. As the number of amended reports increases with improvements in TAT, then you may be sacrificing review for speed. For each KPI, make one decision.
Key Takeaways for Diagnostic Laboratory Owners
Select a small number of KPIs, describe each of these in writing, connect operational metrics with quality indicators, review trends within your organization before making changes, and implement one change at a time. Only when KPIs are used to make decisions do they become effective for managing diagnostic laboratories. To learn more about how to manage your laboratory more effectively, schedule a free demonstration of MargLabz.